The question, methods & findings
Project overview
I examined how personal growth initiative relates to identity formation, self-esteem, and depressive symptoms. I reconstructed a covariance matrix from published correlations and standard deviations for 551 Belgian adolescents and young adults aged 14–35. I fitted path models in lavaan using Wishart maximum likelihood. After exploratory revisions, the final specification had CFI = 0.994 and RMSEA = 0.034, compared with 0.275 and 0.291 for the initial model.
Results
| Specification | χ² | df | CFI | RMSEA |
|---|---|---|---|---|
| Initial | 1904.86 | 40 | 0.275 | 0.291 |
| Final | 37.34 | 23 | 0.994 | 0.034 |
I recomputed these fit statistics on 8 October 2026. model_fit.csv contains all nineteen specifications; I retained model 18 as the final model. In that model, ruminative exploration was associated with lower self-esteem (standardized coefficient = −0.376) and more depressive symptoms (0.361). I report all estimates in final_parameters.csv.
Limitations
I used modification indices to revise the model on the same data, so the final fit may reflect sample-specific choices. Summary data prevent checks of individual response patterns and missingness. The cross-sectional associations do not establish causal mediation.
Credits
This was completed by Laura Maria Fetz. I used the summary statistics reported by Luyckx and Robitschek (2014).
From the project documentation. Download the overview.
The full study
Original report
Original coursework report. The overview above presents a later rerun with a different model specification, so its fit statistics differ from the original results below.
Reshaping the essence of personal growth, identity formation, and well-being in adolescence
Adolescence is a crucial stage of identity development during which new commitments arise and individuals seek to explore new roles. Nonetheless, individuals navigate this period with diverse experiences; some may experience significant growth in self-esteem, while others may struggle with negative self-perceptions and depressive symptoms. A potential reason for these differences could be personal growth initiative (PGI), which defines a person's active and intentional engagement in the growth process and can be divided into four distinct processes: willingness to change, planfulness, use of resources, and intentional behavior (Luyckx et al., 2008).
Previous research has linked growth initiatives to self-esteem and depression (Robitschek, 1998). However, identity formation processes such as commitment-making, identification of commitment, prosocial forms of exploration (exploration in breadth and exploration in depth), and ruminative exploration have also been linked with self-esteem and depression (Robitschek & Keyes, 2009).
Therefore, the main goal of the present study is to investigate whether the path from personal growth initiative to self-esteem and depressive symptoms is fully mediated by individuals' identity formation.
We expect identity formation processes to mediate the relationship between personal growth initiative, self-esteem, and depressive symptoms. For the total indirect effect on self-esteem, we expect a positive, moderate to strong effect. In contrast, we expect the total indirect effect on depressive symptoms to be small to moderate and negative.
Our secondary aim is to explore whether our hypothesized model of full mediation through identity formation processes can be improved by introducing direct effects. We expect the total indirect effects to remain similar and the direct effects of any form of personal growth initiative on depressive symptoms to be negative and of moderate intensity, while we expect direct effects on self-esteem to be of similar intensity but positive.
Methods
Data for this study were derived from the correlation matrix provided by Luyckx and Robitschek (2014), who surveyed 551 adolescents and young adults (aged 14-35 years) in Belgium. Participants completed the following questionnaire:
To measure personal growth, the Personal Growth Initiative Scale (PGIS-II; Robitschek et al., 2012), consisting of 16 items measuring the four PGI on a 6-point Likert scale was used, for which Cronbach's alpha was .75, .86, .82, and .79, respectively. This can be interpreted as acceptable to good internal consistency (Lavrakas, 2008).
The Dimensions of Identity Development Scale (DIDS) (Luyckx et al., 2008), which consists of five items per identity process (i.e., 25 items total) on a 5-point Likert scale, was used to assess identity processes. Cronbach's alpha ranged from .77 to .91, which can be interpreted as acceptable to excellent internal consistency (Lavrakas, 2008).
To assess the outcome variables of self-esteem and depressive symptoms, the Rosenberg Self-Esteem Scale (RSES; Rosenberg, 1965) was used, which consists of 10 items on a 4-point Likert scale and has a good internal consistency of .89 for depressive symptoms and .88 for self-esteem (Lavrakas, 2008).
Primary analysis
We analyzed our hypothesized fully mediated model using structural equation modelling, due to its ability to capture complex relationships in R 4.3.0 (R Core Team, 2011) and the Lavaan package (Rosseel, 2012). As all variables were measured using Likert scales, we treated them as continuous variables. Due to the sample size, and the observed values for internal consistency, we assume that the distribution of the sample means will tend to follow a normal distribution.
We estimated the model parameters using Wishart maximum likelihood with the Nonlinear Models with Bounds (NLMINB) optimization method. Standardized regression coefficients were used to interpret the effect size, for which values between .10-.30 indicate small effects, values between .30–.50 indicate intermediate effect and values larger than .50 indicate strong effects (Bollen, 1988). The alpha level for the analysis was set at α = .05.
Model fit was assessed using the chi-square test of exact fit, root mean square error of approximation (RMSEA), and comparative fit index (CFI). To interpret these fit indices, we followed the following conventions and theoretical constructs:
The chi-square test of exact fit measures the extent to which the predicted covariance matrix of the model matches the observed covariance matrix of the population. This test assumes that exact fit exists in the population. That is, under this null hypothesis, the associated p-value indicates the probability that the difference between the observed covariance matrix and the population covariance matrix is at least as large as can be attributed to random sampling error alone. In this context, observing a significant p-value means that we reject the null hypothesis of exact fit and conclude that the model does not hold in the population.
Additionally, we used the Root Mean Square Error of Approximation (RMSEA) with a 95% confidence interval, as we believe that the null hypothesis of exact fit cannot or rarely be achieved in practice. While the chi-square test of exact fit tests whether the covariance of the population matches the observed covariance of the model, the RMSEA measures whether the covariance of the population approaches the observed covariance of the model. RMSEA is measured based on the sample size, a noncentrality parameter, and the degrees of freedom of the model. We follow Browne and Cudeck’s (1992) suggestion that an RMSEA above .10 indicates a ‘poor’ fit and assume that RMSEA values between .8-.10 indicate a mediocre fit (MacCallum et al., 1996), while values <.05 indicate a ‘close fit’ (Brown and Cudeck, 1992).
In addition, we used the Comparative Fit Index (CFI) as an incremental fit index that compares the model of interest to a baseline model, where the population covariance is assumed to be zero. CFI is a normed alternative to the Tucker-Lewis Index (TLI; Tucker & Lewis, 1973), where CFI > .95 indicates a good fit (Hu & Bentler, 1999).
Secondary analysis
To determine if our initial model could be improved by introducing direct effects for certain forms of personal growth initiative, we made post hoc model modifications based on correlation residuals and modification indices (MIs) with Bonferroni-adjusted α.
The covariance residuals are the result of subtracting the standardized covariance matrix implied by the model from the standardized observed covariance matrix. We assume that large correlation residuals (i.e., >.10) imply unmodeled dependence between the variables.
Modification indices are built into Lavaan and indicate how much the chi-square test of exact fit for a model would decrease if a particular parameter were freely estimated. Because of the Type I error rate inflation, we used the Bonferroni-adjusted α-level for our modification indices, which is calculated by dividing α by the available degrees of freedom.
We decided to stop the model modification process once no residual correlations were greater than .10.
As all our models are nested, we used the chi-squared difference test to compare each model with the previous one. This tests the null hypothesis that there is no difference in the model fit between the two models beyond random variability or sampling error. Therefore, a significant p-value in this context means that there is a significant difference in the model fit. We further reported the Akaike Information Criterion (AIC) as a comparative index, for which lower values generally imply a better fit.
To choose the final model, we decided to plot the RMSEA, CFI, and Chi-square test of the exact fit results from each model on a line graph and to see whether the model that we would choose based on this visual representation is also the preferred model based on the chi-square difference test (i.e., the new model is not significantly different from the previous model).
Results for full mediation
Our hypothesized model with full mediation can be seen in Figure 1 and consists of four exogenous variables and seven endogenous variables, which sums up to a total of 66 known parameters. As our model includes 30 paths between variables and allows for all PGI, Identity processes, and outcome variables to covary with each other, the number of unknown parameters that are estimated in our path model is 58, which means that our model is identified according to the degree of freedom rule. However, it is worth noting that this is a necessary but not sufficient condition. The model explained 27.60% of the variance in self-esteem and 23.90% of the variance in depressive symptoms.
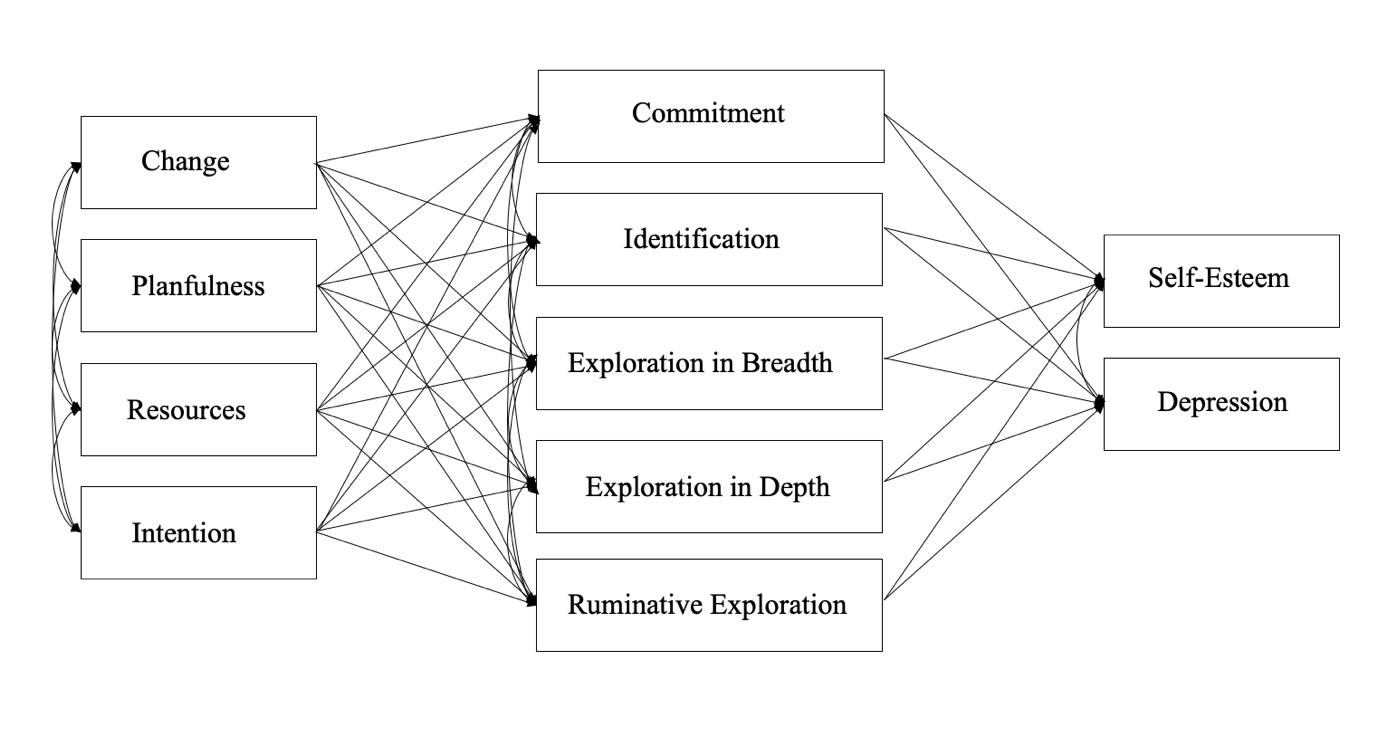
Note: The full mediation allows for all PGI variables, all identity formation processes, and self-esteem and depression to covary, respectively. Residual variances are not shown in this figure but have been estimated.
The full mediation model did not fit the data, according to the chi-square test for exact fit and RMSEA. However, the CFI indicated a good fit: χ2 (8)=31.28, p<.001, RMSEA = 0.07 [0.05; 0.10], CFI = 0.99. Based on these results, we rejected the null hypothesis that the full mediation model fits the data well.
Results for model modification
To improve the model fit, we introduced a direct effect of planfulness on self-esteem. This effect resulted from inspecting the correlation residuals and modification indices and significantly improved our model, Δχ2 (1) = 9.74, p =.002, AIC = 12674. While the CFI value indicated a good fit again, the other fit statistics implied that the model does not fit the data well, χ2 (7) = 21.53, p =.003, RMSEA = 0.06 [0.03; 0.09], CFI = 0.99.
Therefore, we continued to update our model and introduced another direct effect. This direct effect was resources on self-esteem and significantly improved the model fit, Δχ2 (1) = 6.670, p =.010, AIC = 12670. While the CFI value and the RMSEA value indicated good fit, the chi-square value still indicated a poor fit, χ2 (6) = 14.86, p =.021, RMSEA = 0.05 [0.02; 0.09], CFI = 0.99.
The next direct effect that we added was planfulness on depressive symptoms, which also significantly improved model fit, Δχ2 (1) = 11.60, p <.001, AIC = 12660. Further, the resulting model provided an excellent fit to the data, χ2 (5) = 3.27, p =.659, RMSEA = 0.00 [0.00; 0.05], CFI = 1.00, which means that we failed to reject the null hypothesis that the difference between the observed covariance matrix and the population covariance is attributed to random sampling error alone. We continued updating our model as some residual correlations still exceeded .10, but adding additional direct effects did not significantly improve the model based on the chi-square difference test. Furthermore, a visual representation of the model fit statistics clearly showed that the model with three direct effects is the preferred model (see Figure 2).
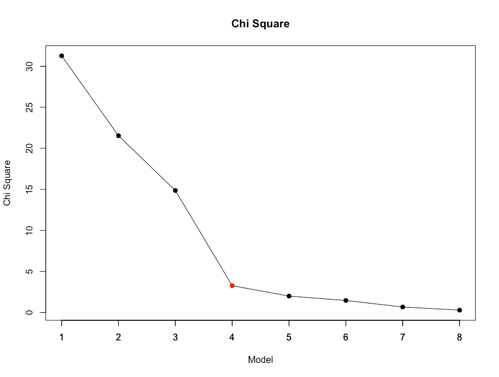
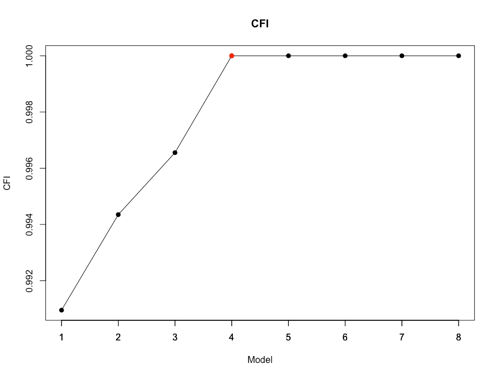
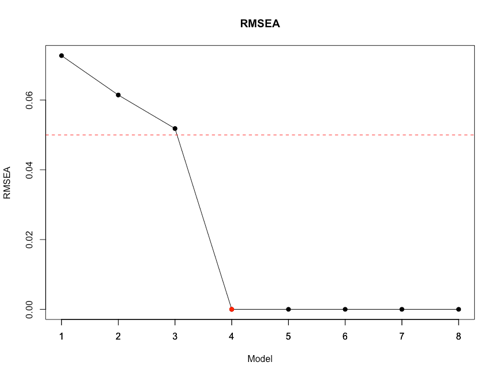
Note: The final model with partial mediation and the three added direct effects is model 4.
Results of the partial mediation model
Our best-fitting model is shown in Figure 3 and consists of 66 known parameters. The addition of three direct effects resulted in 61 unknown parameters in our model. According to the degree-of-freedom rule (which is necessary but not sufficient), our model is still identified. The partial mediation model explained 30.7% and 25.5% of the variance in self-esteem and depressive symptoms, respectively.
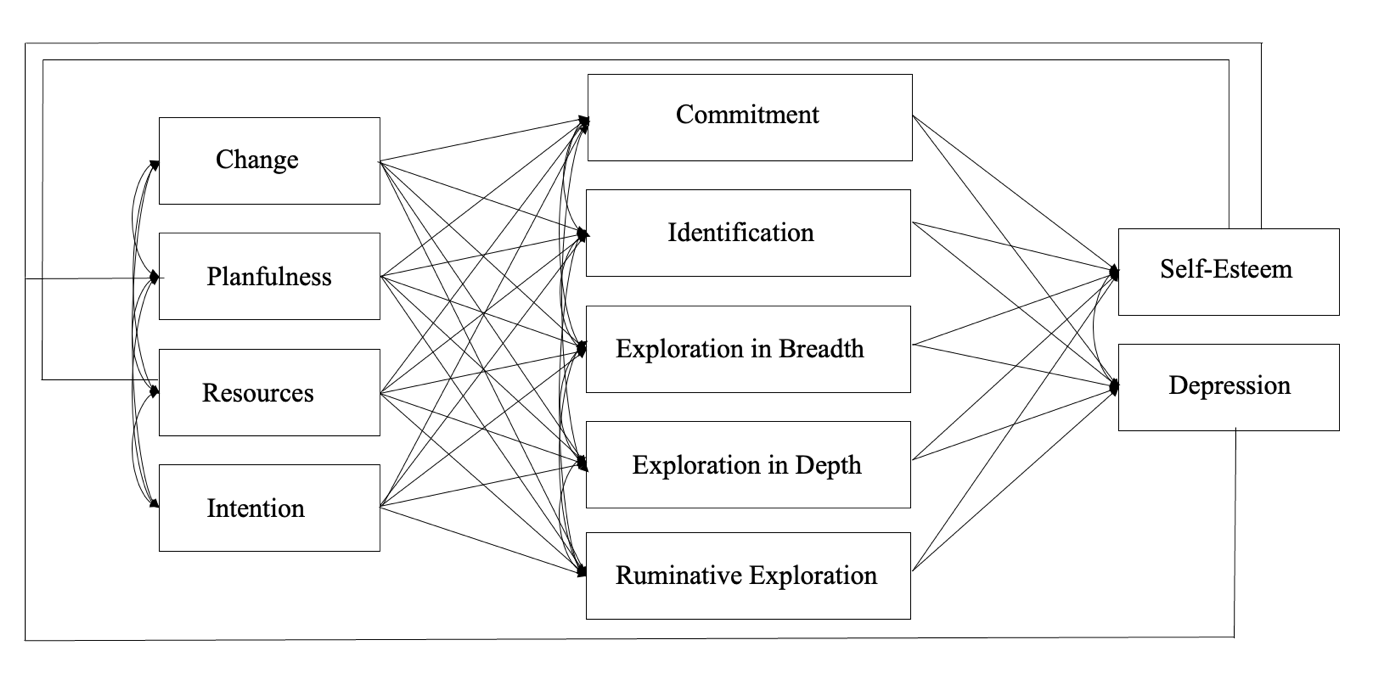
Note: Residual variances are not shown in this figure but have been estimated.
As previously mentioned, the overall fit of the final model was excellent: χ2 (5) = 3.27, p =.659, RMSEA = 0.00 [0.00; 0.05], CFI = 1.00.
The direct effects of planfulness on self-esteem, b = 0.10, p = 0.001, 95% CI = [0.04; 0.16], which we added, was significant and according to our hypothesized direction. This implies that, with every one-unit increase in planfulness, self-esteem is expected to increase by 0.10. This effect can be interpreted as small, b* = 0.14. The direct effect of planfulness on depressive symptoms was also significant (b = -0.10, p = 0.001, 95% CI = [-0.16, -0.04]), which is in line with our hypothesized direction. This effect was small, b* = -0.14, implying that depressive symptoms are expected to decrease by -0.10 with every unit increase in planfulness. The final direct effect we added was resources on self-esteem, b = 0.05, p = 0.010, 95% CI = [0.01; 0.09], which was also significant and in line with our hypothesized direction. However, the size of this effect is negligible.
Regarding the total indirect effects, we observed that contrary to our hypothesis, all total indirect effects yielded positive results, but the total indirect effects of change, planfulness, and resources, mediated by identity formation processes on self-esteem, were non-significant. However, we observed a significant, moderate, positive total indirect effect of intention mediated by identity formation processes on self-esteem, b = 0.41, p < .001, 95% CI = [0.08, 0.73], b* = 0.36.
For the total indirect effects on depressive symptoms, we observed strong significant effects for all personal growth initiative types of PGI mediated by identity-formation processes (change, b = 0.47, p = 0.01, CI = [0.10, 0.84], b* = 0.55; planfulness, b = 0.49, p = 0.06, 95% CI = [0.14, 0.83], b* = 0.63; resources, b = 0.42, p <.001, 95% CI = [0.21, 0.64], b* = 0.60; intention, b = 0.66, p < .001, 95% CI = [0.34, 0.99], b* = 0.79).
An overview of all estimated parameters is provided in Table 1 in the appendix.
Conclusion
Our analysis showed that, given our data, the relationship between personal growth imitative and self-esteem and depressive symptoms is not fully mediated by identity formation processes. However, our findings indicate that there are significant total indirect effects of personal growth initiative on self-esteem and depressive symptoms, supporting the idea that personal growth initiative plays a positive role in fostering self-esteem and depressive symptoms through identity formation processes.
Our exploratory analysis, which introduced direct effects, resulted in a partial mediation model that provided an excellent fit for the data. The introduction of direct effects improved the model's ability to explain the variance in self-esteem and depressive symptoms. This suggests that certain aspects of personal growth initiative may directly influence self-esteem and depressive symptoms in addition to their indirect effects through identity formation.
In conclusion, our analysis showed that the relationship between personal growth initiative, self-esteem, and depressive symptoms is not fully mediated by identity formation processes. Instead, there appeared to be direct effects and complex interactions at play. Our findings highlight the need for a more nuanced understanding of how personal growth initiative impacts the well-being of adolescents and young adults and the role of identity formation in this process.
References
Bollen, K. A. (1990). Overall fit in covariance structure models: Two types of sample size effects. Psychological Bulletin, 107(2), 256–259. https://doi.org/10.1037/0033-2909.107.2.256
Browne, M.W. and Cudeck, R. (1992) Alternative Ways of Assessing Model Fit. Sociological Methods and Research, 21, 230-258. https://doi.org/10.1177/0049124192021002005
Hu, L.-t., & Bentler, P. M. (1999). Cutoff criteria for fit indexes in covariance structure analysis: Conventional criteria versus new alternatives. Structural Equation Modeling, 6(1), 1–55. https://doi.org/10.1080/10705519909540118
Lavrakas, P. J. (2008). Encyclopedia of survey research methods. Sage publications.
Luyckx, K., Soenens, B., Goossens, L., Beckx, K., & Wouters, S. (2008). Identity exploration and commitment in late adolescence: Correlates of perfectionism and mediating mechanisms on the pathway to well-being. Journal of Social and Clinical Psychology, 27(4), 336–361. https://doi.org/10.1521/jscp.2008.27.4.336
Luyckx, K., & Robitschek, C. (2014). Personal growth initiative and identity formation in adolescence through young adulthood: Mediating processes on the pathway to well-being. Journal of Adolescence, 37(7), 973–981. https://doi.org/10.1016/j.adolescence.2014.07.009
MacCallum, R. C., Browne, M. W., & Sugawara, H. M. (1996). Power analysis and determination of sample size for covariance structure modeling. Psychological Methods, 1(2), 130–149. https://doi.org/10.1037/1082-989X.1.2.130
R Development Core Team (2011) R: A language and environment for statistical computing. R Foundation for Statistical Computing, Vienna. http://www.R-project.org
Robitschek, C. (1998). Personal growth initiative: The construct and its measure. Measurement and Evaluation in Counseling and Development, 30(4), 183–198.
Robitschek, C., & Keyes, C. L. M. (2009). Keyes's model of mental health with personal growth initiative as a parsimonious predictor. Journal of Counseling Psychology, 56(2), 321–329. https://doi.org/10.1037/a0013954
Robitschek, C., Ashton, M. W., Spering, C. C., Geiger, N., Byers, D., Schotts, G. C., & Thoen, M. A. (2012). Development and psychometric evaluation of the Personal Growth Initiative Scale-II. Journal of counseling psychology, 59(2), 274–287. https://doi.org/10.1037/a0027310
Rosenberg, M. (1965). Society and the Adolescent Self-Image. Princeton University Press. http://www.jstor.org/stable/j.ctt183pjjh
Rosseel, Y. (2012). lavaan: An R Package for Structural Equation Modeling. Journal of Statistical Software, 48(2), 1–36. https://doi.org/10.18637/jss.v048.i02
Tucker, L.R., Lewis, C. A reliability coefficient for maximum likelihood factor analysis. Psychometrika 38, 1–10 (1973). https://doi.org/10.1007/BF02291170
Appendix
Exogenous variables | ||||||||||||
|---|---|---|---|---|---|---|---|---|---|---|---|---|
Readiness for Change | Planfulness | Using Resources | Intentional Behavior | |||||||||
Endogenous variables | Unst. | [95% CI] | Std. | Unst. | [95% CI] | Std. | Unst. | [95% CI] | Std. | Unst. | [95% CI] | Std. |
Commitment making | ||||||||||||
Direct | -0.05 | [-0.19;0.09] | -0.05 | 0.27 | [0.14; 0.40] | 0.25 | 0.02 | [-0.06; 0.09] | 0.02 | 0.09 | [-0.03; 0.21] | 0.08 |
Identification commitment | ||||||||||||
Direct | 0.03 | [-0.09; 0.15] | 0.03 | 0.34 | [0.23; 0.45] | 0.36 | 0.02 | [-0.04; 0.08] | 0.03 | 0.04 | [-0.06; 0.14] | 0.04 |
Exploration in breadth | ||||||||||||
Direct | 0.08 | [-0.03; 0.19] | 0.09 | 0.06 | [-0.05; 0.16] | 0.07 | 0.03 | [-0.03; 0.09] | 0.04 | 0.19 | [0.10; 0.29] | 0.22 |
Exploration in depth | ||||||||||||
Direct | 0.05 | [-0.06; 0.16] | 0.05 | 0.09 | [-0.01; 0.20] | 0.11 | 0.12 | [0.06; 0.18] | 0.17 | 0.20 | [0.10; 0.30] | 0.22 |
Ruminative exploration | ||||||||||||
Direct | 0.22 | [0.08; 0.36] | 0.20 | -0.41 | [-0.54; -0.28] | -0.39 | 0.09 | [0.02; 0.17] | 0.11 | -0.00 | [-0.13; 0.12] | -0.00 |
Self-esteem | ||||||||||||
Direct | 0.10 | [0.04; 0.16] | 0.14 | 0.05 | [0.01; 0.09] | 0.09 | ||||||
Total indirect | 0.22 | [-0.15;0.59] | 0.13 | 0.23 | [-0.11;0.58] | 0.20 | 0.17 | [-0.05;0.38] | 0.17 | 0.41 | [0.08;0.74] | 0.36 |
Total | 0.22 | [-0.15;0.59] | 0.13 | 0.33 | [-0.01;0.68] | 0.35 | 0.22 | [0.00;0.44] | 0.27 | 0.41 | [0.08;0.74] | 0.36 |
Depressive symptoms | ||||||||||||
Direct | -0.10 | [-0.16; -0.04] | -0.14 | |||||||||
Total indirect | 0.47 | [0.10;0.84] | 0.55 | 0.49 | [0.14;0.83] | 0.63 | 0.42 | [0.21;0.64] | 0.60 | 0.66 | [0.36;0.99] | 0.79 |
Total | 0.47 | [0.10;0.84] | 0.55 | 0.38 | [0.04;0.73] | 0.48 | 0.42 | [0.21;0.64] | 0.60 | 0.66 | [0.36;0.99] | 0.79 |
Scroll the table to see all columns.
Note: This table does not provide total effects for the endogenous variables: Commitment making, Identification commitment, Exploration in breadth, Exploration in depth, and Ruminative exploration, as these are equivalent to the direct effects provided, due to the structure of our final model. Significant effects are those that do not contain zero in their 95% CI.